
The IPL 2026 Sponsorship Valuation Index: Six Findings From Frame-Level Measurement
Every IPL season produces a wave of sponsorship reports. Almost all of them count the same thing: how long each logo was on screen.
We measured a full IPL 2026 broadcast differently. Every frame scored for size, position, motion, readability, contrast, standout and competitive crowding. Live audience attached to each individual visibility streak rather than averaged across the match. Value converted against the rate card for that specific broadcast segment.
Seven findings came out of it that the current exposure report structurally cannot produce.
Scope, stated up front: this article covers one jersey-position sponsor across one IPL 2026 league match, 180 measured visibility streaks. It is a deep read of one asset, not a league-wide census. The findings below are patterns worth testing at scale, and we say where each one is likely to generalize and where it is not. The sponsor is anonymized.
Citation: these figures are free to quote and reproduce with attribution to TrueVal. No form, no email wall.
Finding 01 - Screen time overstates paid-media equivalence by about 17 to 1
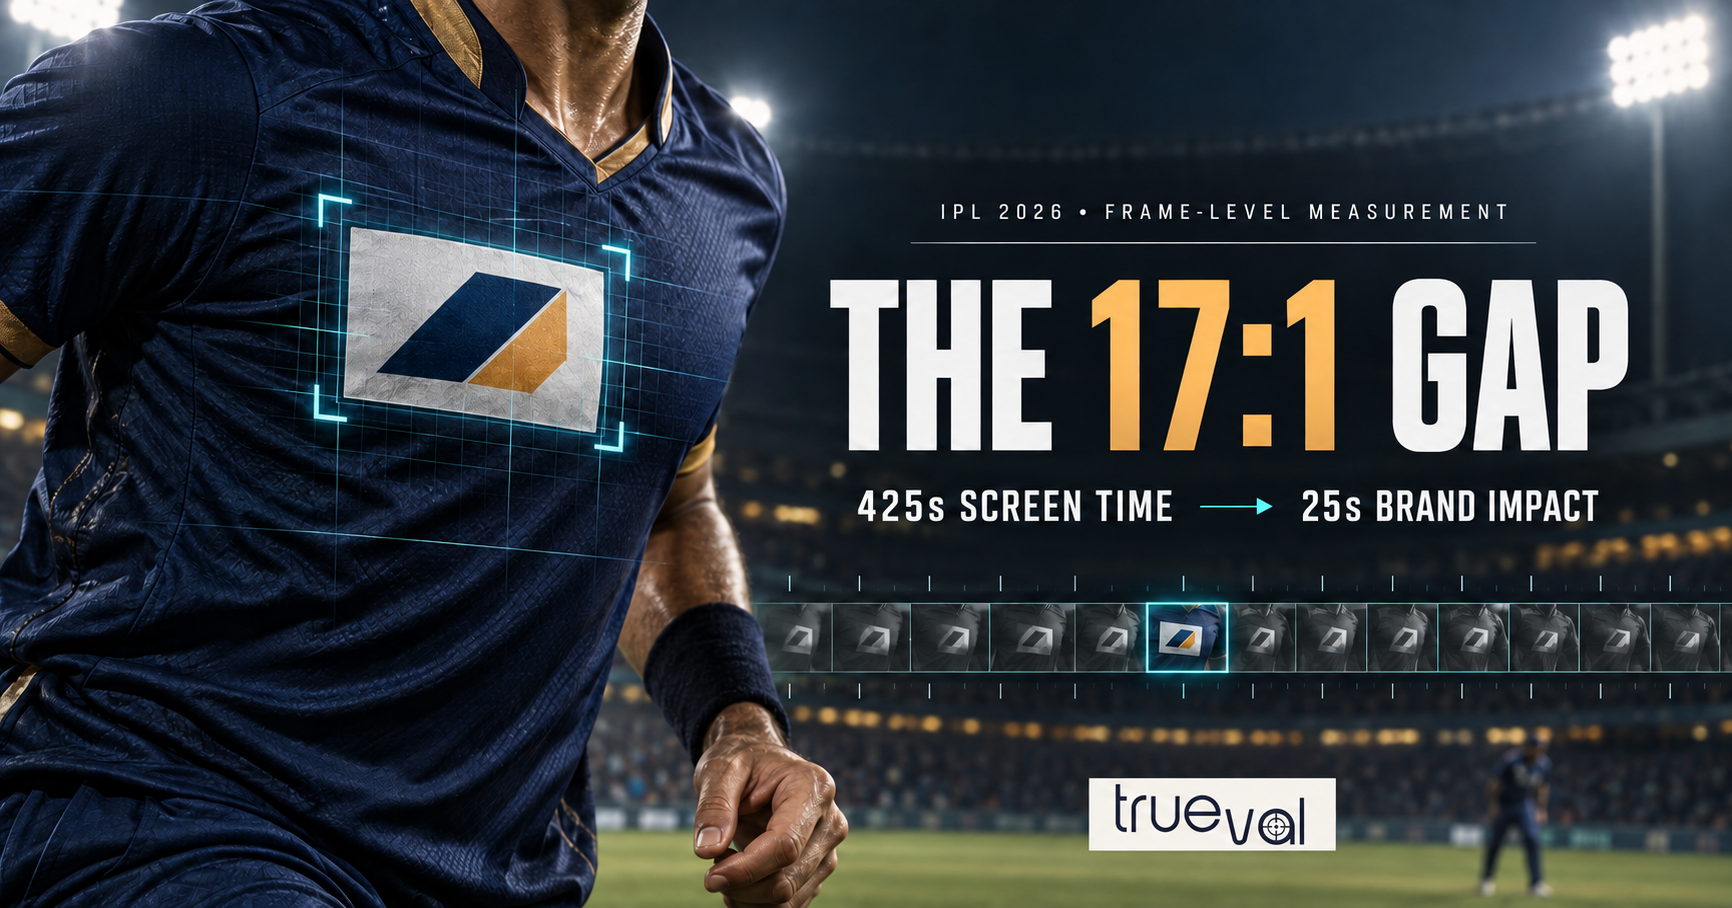
In the first innings, the sponsor's logo held 7 minutes 5 seconds of in-content readable visibility inside 122 minutes of content.
That converted to 25 Brand Impact Seconds: the amount of paid ad time, in that same segment, the visibility was actually worth.
425 seconds of screen time. 25 seconds of paid-media equivalence. A ratio of about 17 to 1.
In the pre-match show the ratio was worse: 40 seconds of visibility converted to 1 second, a ratio of 40 to 1.
This is the single most consequential gap in sponsorship reporting. A report that leads with "over 7 minutes of brand exposure" is not wrong about the seconds. It is quoting a number that is an order of magnitude away from what a media buyer would pay for.
Finding 02 - There is a six times rate-card spread inside a single broadcast
Each match. Every night - Four segments.
SEGMENT        TV BASE/10s   EFFECTIVE   CPM
LIVE Innings     ₹15,00,000  ₹13,50,000  ₹203
Pre/Post Show    ₹2,50,000   ₹2,25,000   ₹68
Six times on TV. Three times on digital CPM. Inside the same broadcast.
Every measurement method that applies one match-level rate is systematically mispricing something. If a sponsor's inventory skews toward the pre-match show, a blended rate flatters it. If it skews toward live play, a blended rate robs it.
This is also a negotiation finding, not just a measurement one. Two sponsorship packages with identical "seconds on screen" guarantees can differ by a factor of six in delivered value, depending entirely on which part of the telecast they land in. That distinction is rarely priced into the contract.
Does it generalise? Yes. Segment rate spreads are a structural feature of Indian cricket broadcast, not an artefact of this match.
Finding 03 - Digital carried 64% of the value
LAYER      VALUE          SHARE
TV         ₹38,45,783       36%
Digital    ₹68,77,395       64%
Blended  ₹1,07,23,177      100%
Impressions: 3,43,75,604. Impact views: 7.6 crore.
Nearly two-thirds of the measured value came off the OTT/digital feed.
The implication for a sponsor is uncomfortable: if your measurement, your reporting and your renewal negotiation are all built around the TV feed, you are pricing roughly a third of what you bought and arguing about the wrong number.
Finding 04 - 88% of a sponsor's value landed in one innings
SEGMENT           BLENDED    SHARE  STREAKS
Pre Match Show     ₹45,008    0.4%       11
First Innings   ₹94,31,419   88.0%      140
Second Innings  ₹11,92,276   11.1%       26
Post Match Show    ₹54,474    0.5%        3
Share of voice tells the same story: 5.8% in the first innings, 0.9% in the second.
This is not a measurement artefact. It is a structural feature of jersey sponsorship. Different logos have different innings skews, because the broadcast camera focuses on the players in different ways.
Nobody prices a jersey deal for this. Somebody should.
Finding 05 - Live audience per streak varied by 60 times inside one match
Per-streak concurrent audience ranged from 2.8 lakh during the early pre-match show to 1.7 crore in the middle of the first innings.
A sixtyfold spread. Inside one broadcast.
This is why our per-streak audience attachment is not a technical nicety. A method that applies a match-average audience to every exposure is treating a 2.8 lakh moment and a 1.7 crore moment as the same asset. Combine that with the six times rate spread from Finding 02 and the error compounds: at the extremes, two identical-looking seconds of exposure differ in real value by several hundred times.
Finding 06 - Reach and audience are different numbers, and the industry keeps conflating them
The match peaked at 22.00 crore cumulative reach and 2.8 crore estimated active concurrent human audience, after modelling inflow, churn and cross-platform overlap.
Both figures are true. They answer different questions.
Cumulative reach counts everyone who tuned in at any point across the broadcast. Concurrent audience counts how many people were watching at the same moment.
Only the second one describes people who could have seen your logo in a given second.
The tempting read is that the gap between 22 crore and 2.8 crore proves somebody inflated something. That read is wrong, and we want to say so clearly because it will be the most quoted number in this piece. Nobody inflated anything. A reach figure attached to a one-second visibility streak is a category error, not a fabrication.
The practical consequence: when a property quotes you reach and a measurement vendor quotes you audience, you are being given two correct answers to two different questions. Ask which one is driving the valuation.
The index, in one block
Visibility streaks           180
Blended media value  ₹1,07,23,177
  TV                   ₹38,45,783
  Digital              ₹68,77,395
Impressions          3,43,75,604
Impact views              7.6 Cr
Brand Impact Seconds         30s
Share of voice, match       2.9%
SOV, first innings          5.8%
Screen-time to BIS        ~17:1
In-match TV rate spread       6x
In-match audience spread     60x
Avg screen share       0.5-1.7%
Peak cumulative reach    22.00 Cr
Peak concurrent audience   2.8 Cr
Method
Every frame of the broadcast was assessed against a minimum captured-area floor. Frames below it do not count. Above the floor, each frame was scored continuously on size, position, motion, readability (OCR on the mark), contrast, standout and competitive co-presence. Qualified frames grouped into streaks.
Each streak carries its own concurrent audience figure. Value was calculated per segment:
eff TV rate  = base rate per 10s × 0.90
BIS          = TV value ÷ eff per-sec TV rate
digital      = impressions × (CPM ÷ 1000)
impact views = duration × viewers × share
blended      = TV value + digital
The full method, with the math behind it, comes attached with each report bought from TrueVal.
Questions we get asked
Which IPL logo placement delivers the most value? On this evidence, the answer depends less on placement than on segment. A jersey position concentrated 88% of its value in the innings its team fielded. The more useful framing is not "which asset" but "which part of the telecast does this asset live in," because the rate card inside one broadcast varies by six times.
What is an IPL jersey sponsorship worth per match? The one measured here delivered ₹1,07,23,177 in blended media value across a single league match. But you don't know which team and what spot is this. Treat that as one data point, not a benchmark. Value varies with fixture, timeslot, team camera share and the toss.
Will you publish a full-season index? NO. But you can buy it from us and if you choose to buy IPL 2027 sponsorship through our partner agency Just About Sportz & Showbiz then you will get the entire amount paid back to you in credit.
How do I get this for my own brand? just visit trueval.justaboutsportz.com and get in touch, or DM us on Linkedin.
The IPL 2026 Sponsorship Valuation is published by TrueVal, a sponsorship measurement product from Just About Sportz and Showbiz Pvt Ltd, Mumbai. Figures are exact as measured, not rounded. Sponsor anonymised. Press enquiries and data requests welcome.
Also published on LinkedIn
Join the conversation there.