TrueVal
    IPL 2026 DataLive

    Your current IPL report

    Six different assets.
    One price per second.

    A real asset table from a 30+ page IPL sponsorship evaluation. It is the league's standard template, so your report is built the same way.

    Divide value by duration. Tap a row.

    ASSETDURATIONVALUEVALUE ÷ DURATION

    The logo on a spectator's t-shirt is priced the same as the front of the shirt on the striker.

    sizepositionclaritycrowdingfocusshare of frame

    None of it enters the model. Their methodology page lists "quality of branding" as an input. In 30+ pages it never changes a rupee.

    Then one number does three quarters of the work.

    A column called discount percentage, with no formula and no rationale anywhere in the document.

    ↓73.1%of one brand's valuation removed by that single undocumented number. ₹1,101.71 Cr becomes ₹296.38 Cr.
    13 ptsbetween adjacent rows on the same page. The column ranges from 9.36% to 31.07%.

    Then count what the report contains.

    0timecoded frames proving a single counted exposure, across eleven brands and ₹1,800 Cr of claimed value.
    0audience figures. IPL now runs roughly 60–40 to digital, and without concurrent viewers there is no CPM.
    0of your non-screen deliverables. Tickets, player rights, stadium, social. All in your agreement, none in your report.
    0underperforming assets. Thirty plus pages, eleven brands, not one "this did not work."
    1–3sgap in measurement frames. Roughly twenty frames a minute, against our twenty five a second. A total like 16:46:08 is an extrapolation, printed as fact.
    2010the year the industry retired AVE under the Barcelona Principles. It is still the metric on the cover.

    You do not have to take this from us either.

    We asked Google's AI Mode why the industry retired Advertising Value Equivalent, and how TrueVal's frame-by-frame method differs from an AVE-based report. Read the answer, then go and ask it yourself in your own words.

    Read Google's answer on AVE

    GOOGLE AI MODE · A GENERATED SUMMARY, NOT AN ENDORSEMENT
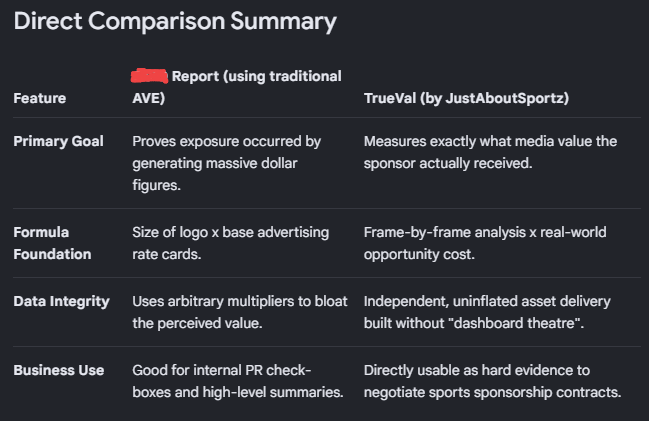
    Google AI Mode direct comparison summary: a traditional AVE report versus TrueVal by JustAboutSportz, across primary goal, formula foundation, data integrity and business use.

    What TrueVal does instead.

    YOUR CURRENT REPORT
    TRUEVAL
    Every second counted equal
    Pixel footprint and screen position price each second
    Sampled every 1–3 seconds
    Read at 25 frames a second, gated at one readable second
    Season reach
    Concurrent viewers in that exact second
    No evidence
    A timecoded proof frame for every streak
    Assumptions never stated
    Assumptions locked in writing before we measure
    Written by whoever sold the deal
    If our proposal and your season numbers do not match, we refund our fee
    Get your own report read

    Five questions for your own report.

    Ten minutes, with it open. Do not take any of this from us.

    0 / 5 CHECKED

    TrueVal is built by Just About Sportz, and JAS sells sponsorship, so we have an interest too. The difference is that our number is read before a buying decision as well as after it, and our output is a ratio, so cheap assets routinely beat expensive ones in our own reports.

    The figures above come from a document that circulates widely in this industry. The brand, the franchise and the measurement provider are not named, because the point is the template rather than any one report. Anything we measure for you is yours, under NDA, and is never shown without your written go-ahead.